About AIN GROUP
The AIN Group operates Japan’s leading dispensing pharmacy business and a unique retail business. Over the years, we have achieved sustained growth by expanding these businesses while consistently anticipating and responding flexibly to changes in the operating environment. Going forward, the Group will continue working to increase corporate value as a company that contributes to society and supports people everywhere.
Corporate Profile
| Company name | AIN HOLDINGS INC. |
|---|---|
| Representative | Kiichi Otani, President and Representative Director |
| Established | August 1969 |
| Capital | ¥21,894 million (As of April 30, 2025) |
| Stock exchange listings | Prime Market of Tokyo Stock Exchange and Sapporo Securities Exchange |
| Business lines | Planning, management and operation of the corporate Group, focused on pharmacy, cosmetics store, and interior furnishing shop operations, generic drug wholesaling, sales of cosmetics, and operation of retail shops, and the Group’s other businesses |
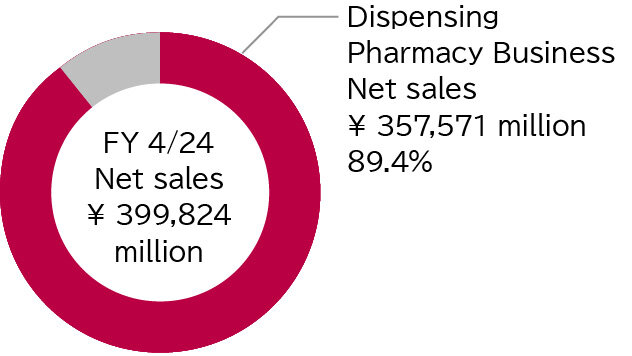
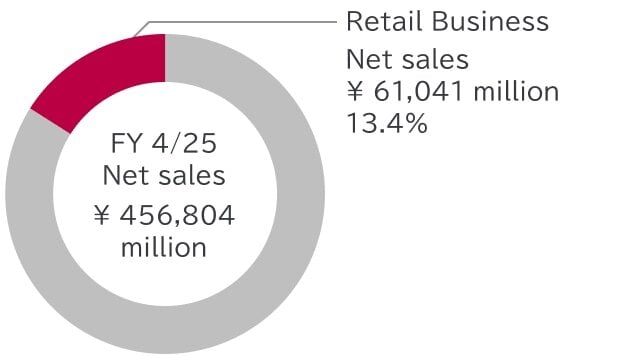
| Net sales and operating income | Net sales: ¥456,804 million Operating profit: ¥16,871 million (FY4/25) |
| Sales composition | Dispensing pharmacy business: ¥384,783 million Retail business: ¥61,041 million Others: ¥10,980 million (FY4/25) |
| Number of employees | 18,300 (including 6,786 pharmacists) (As of April 30, 2025) |
| Number of stores | 1,550 (1,290 dispensing pharmacies. 95 cosmetics stores. 165 interior furnishing stores.)(FY4/25) |
Dispensing Pharmacy Business
Aiming to be Dispensing Pharmacies which support local healthcare services
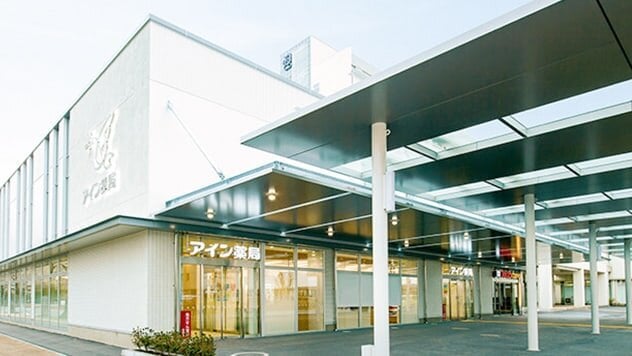
We operate more than 1,200 dispensing pharmacies nationwide.
The ideal way of dispesing pharmacies are changing because of aging society and advancement of medical care. AIN Group aims to be dispensing pharmacies which support local healthcare services by strengthening their functions and cooperating with various occupations more than ever before.
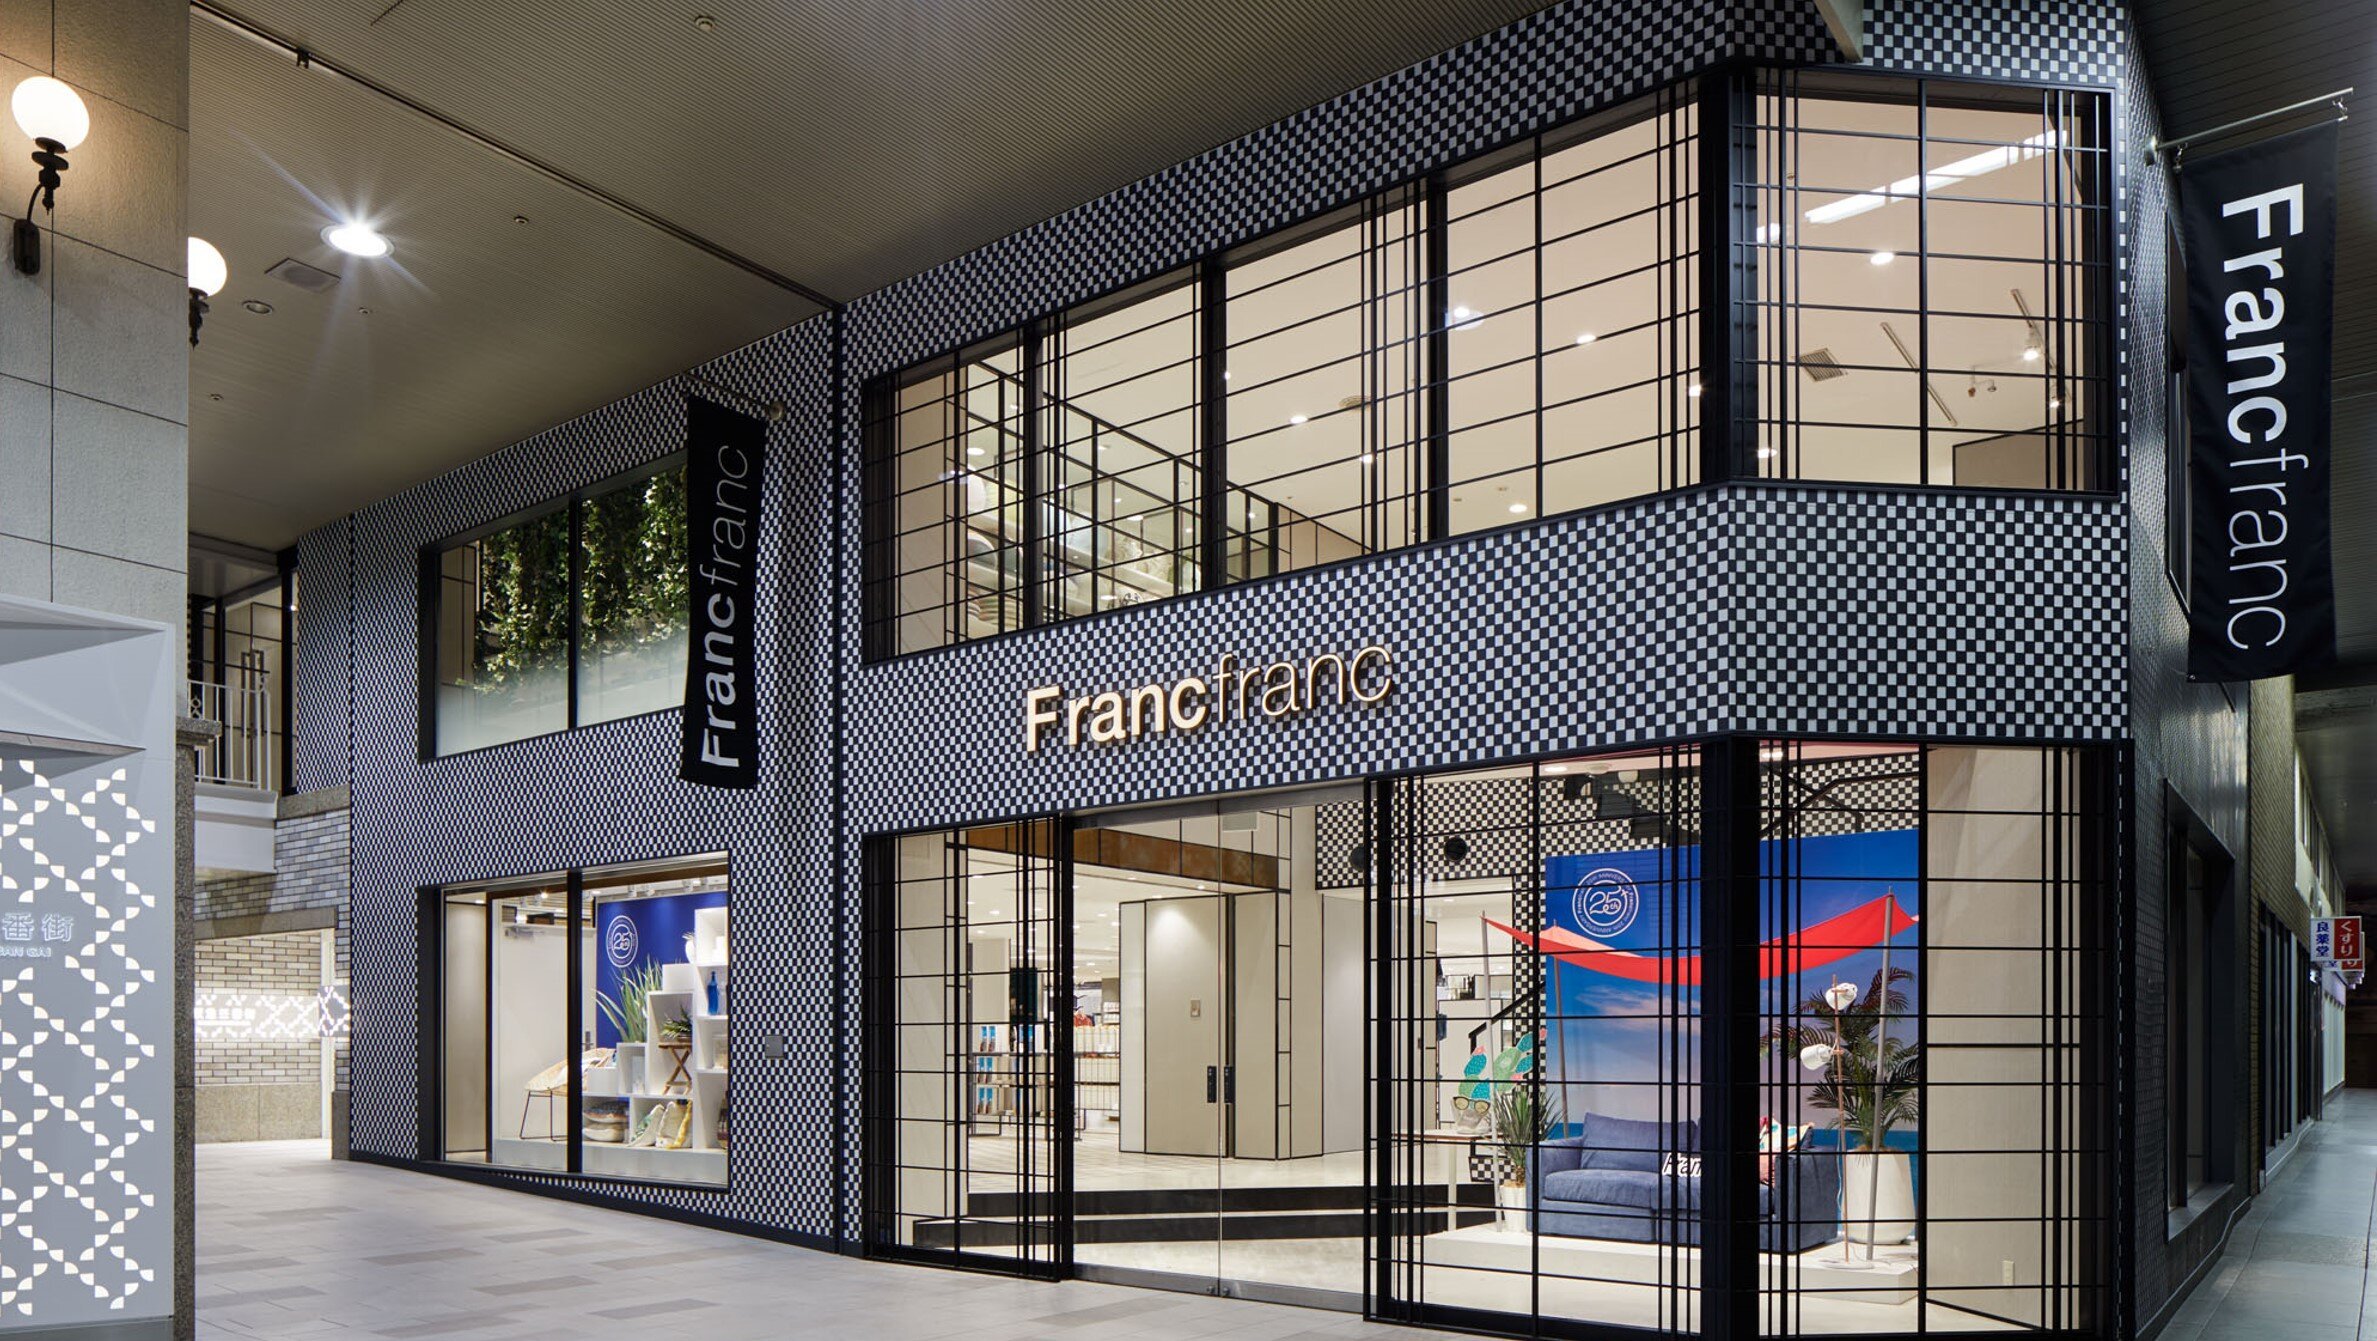
Retail Business
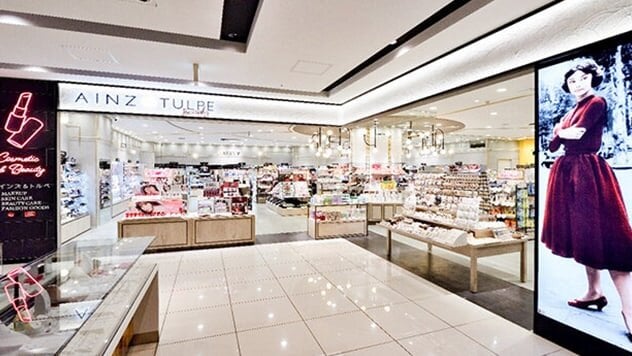
Providing Beauty and Happiness
AINZ & TULPE stores are comprehensive beauty outlets which offer customers expectations to become beautiful. Their features are in highly convenient locations, blight and clean store designs that allow custmores to take their time to browse through products, and have wide selections of cosmetics which we can highly recommend. In addition, the stores are designed in a way that is unique to AINZ & TULPE depend on locations and trends. We continue to create opportunities for everyone to pursue beauty as our new brand that is completely different from normal drug stores. In addition, Francfranc stores, selling interior goods and sundries, offers urban and sophisticated lifestyle proposals.
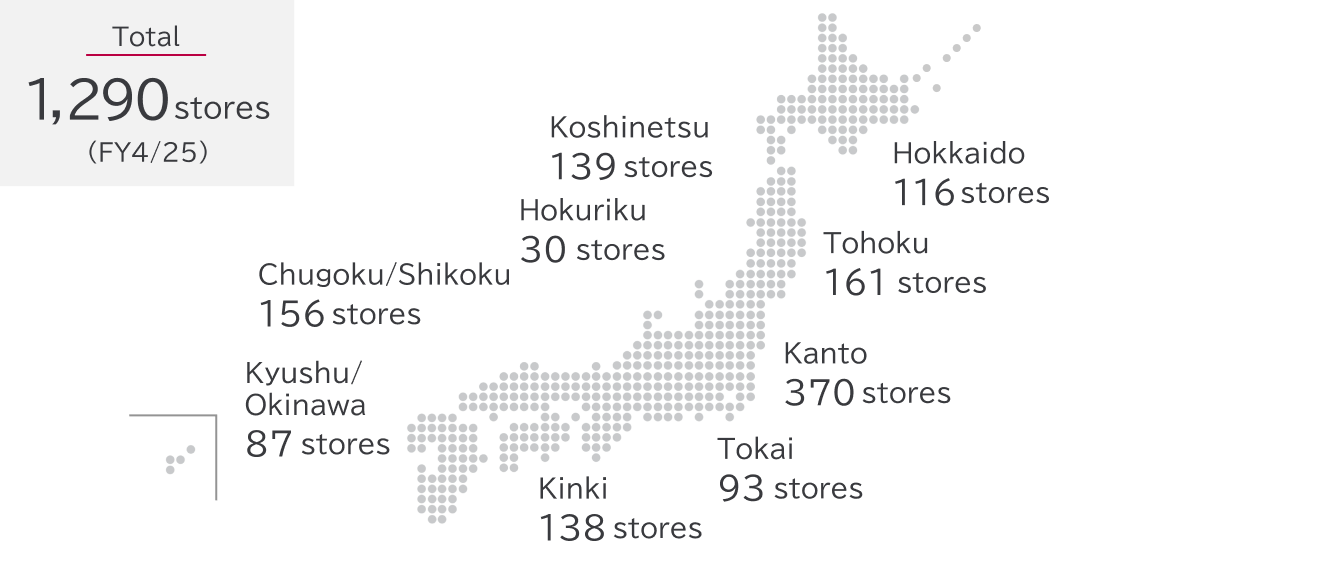
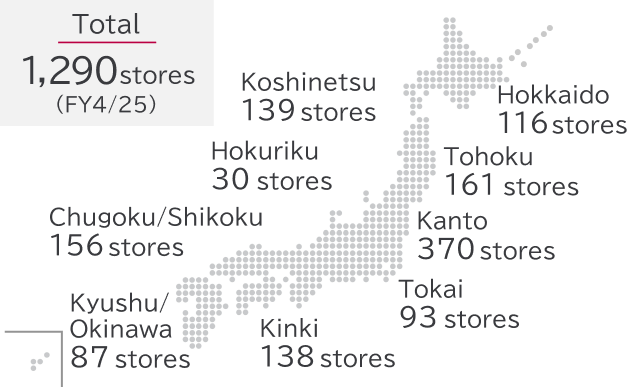
Scale of Business
Promoting More Than 1,300 of Dispensing Pharmacy Business and Cosmetic and Drug Store Business
We operate dispensing pharmacy business and retail business nation wide.
In 2016, the total number of our store exceeded 1,000. We aim for more expansion to be an infrastructure of local healthcare service.
Number of Dispensing Pharmacies
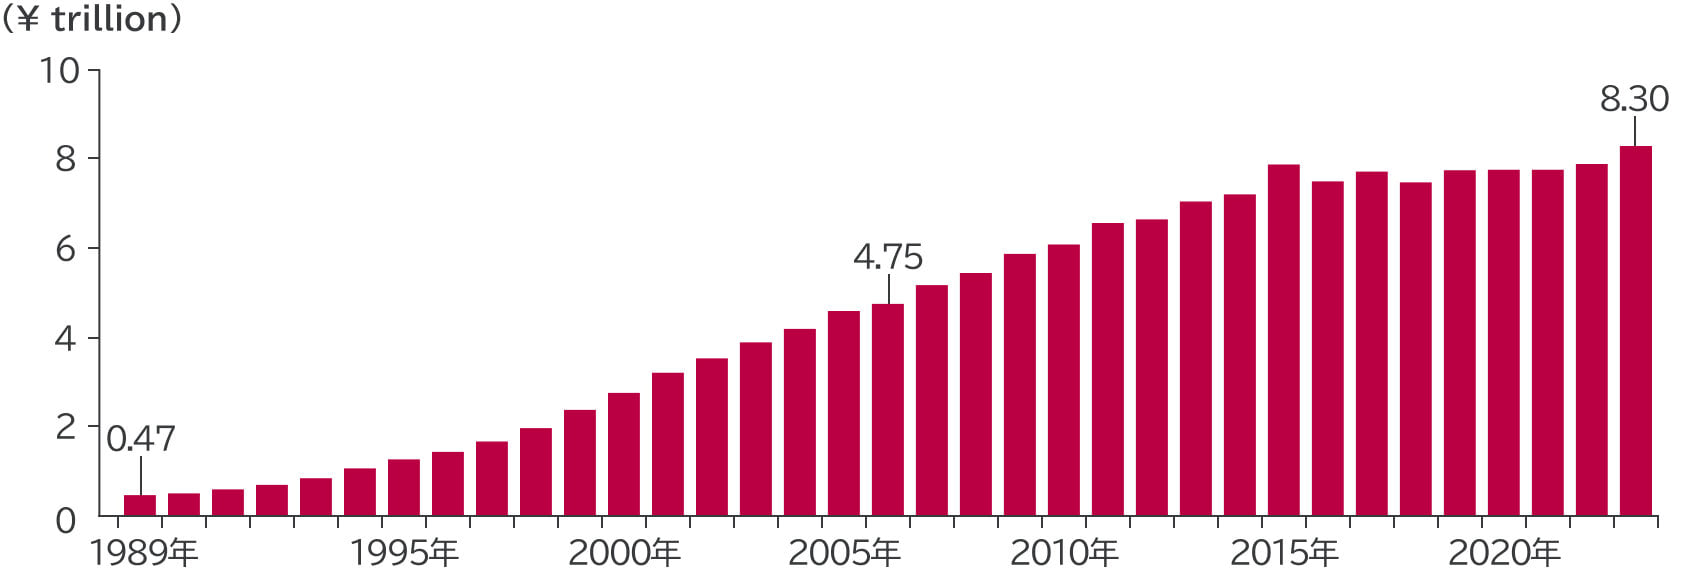
Japan's Dispensing Pharmacy Sector
Japan’s dispensing pharmacy market was worth roughly ¥8.3 trillion in fiscal 2024 (April 2023 to March 2024), but the market remains fragmented. While the market has matured, deregulation such as the start of online pharmaceutical guidance and a new pharmacy certification scheme are likely to lead to wider gaps in performance between dispensing pharmacy companies. The AIN Group aims to increase market share by responding to these changes in the operating environment.
Dispensing pharmacy market value
Non-hospital dispensing ratio/Ratio of elderly people
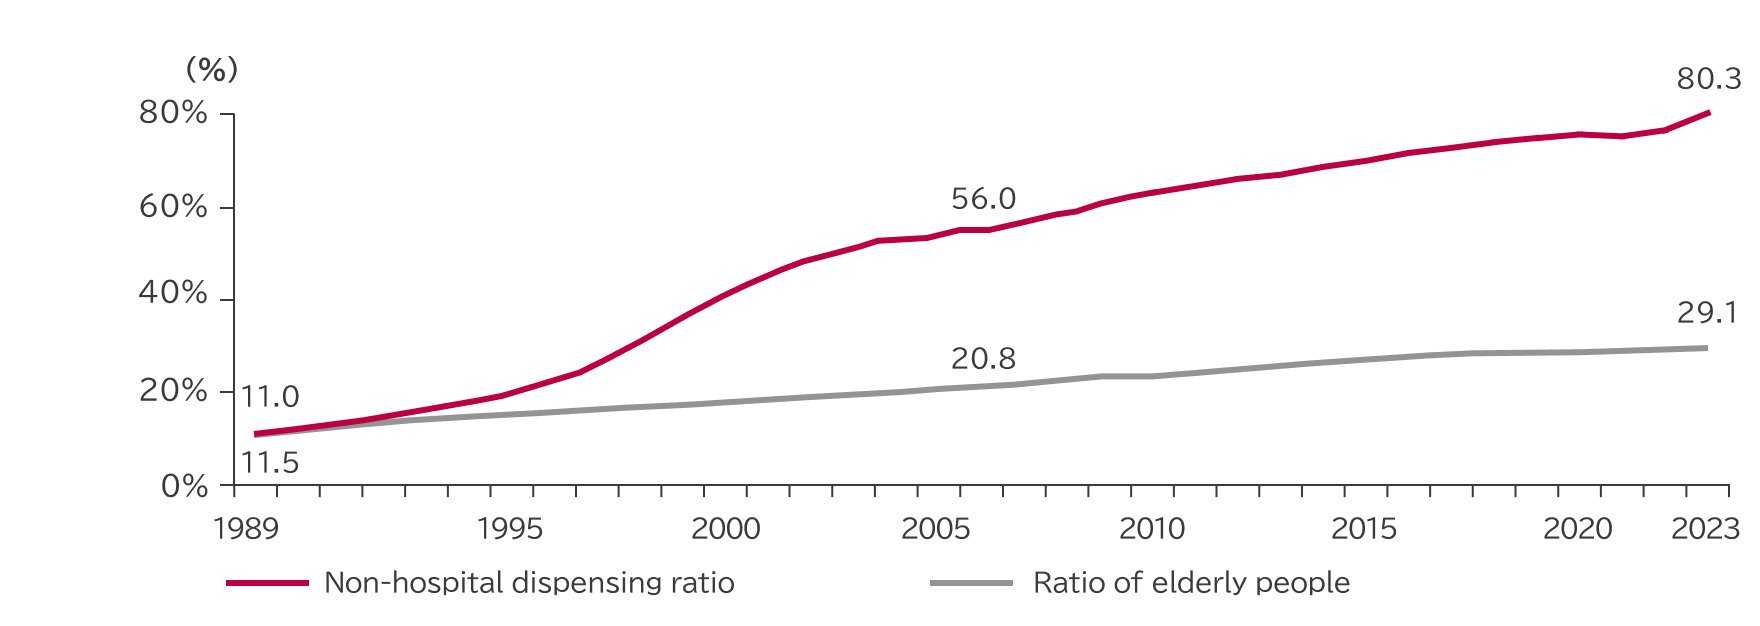
Source: Japan Pharmaceutical Association, Trends in Dispensing Pharmaceutical Expenditure (Ministry of Health, Labour and Welfare), White Paper on Ageing Society (Cabinet Office)
Difference between Japan and US
| Japan | US | |
|---|---|---|
| Medical insurance (patient cost) | Universal healthcare (0-30%) | Private health insurance (depends on contract terms) |
| Freedom to select hospitals by patients | No restrictions | Affiliated service providers |
| Non-hospital dispensing ratio | 80.3% (fiscal 2024 (April 2023 to March 2024) | 100% |
| Drug prescriptions | Repeat ○ hard copy / patient data | Repeat ○ hard copy / patient data |
| Drug prices | Set by the government (Revised regularly) | Market price |